scale_x_bp() is the default scale for genomic x-axis. It wraps
ggplot2::scale_x_continuous() using label_bp() as default labeller.
Usage
scale_x_bp(..., suffix = "", sep = "", accuracy = 1)

label_bp(suffix = "", sep = "", accuracy = 1)
Arguments
- ...
Arguments passed on to
ggplot2::scale_x_continuous()- suffix
unit suffix e.g. "bp"
- sep
between number and unit prefix+suffix
- accuracy
A number to round to. Use (e.g.)
0.01to show 2 decimal places of precision. IfNULL, the default, uses a heuristic that should ensure breaks have the minimum number of digits needed to show the difference between adjacent values.Applied to rescaled data.
Examples
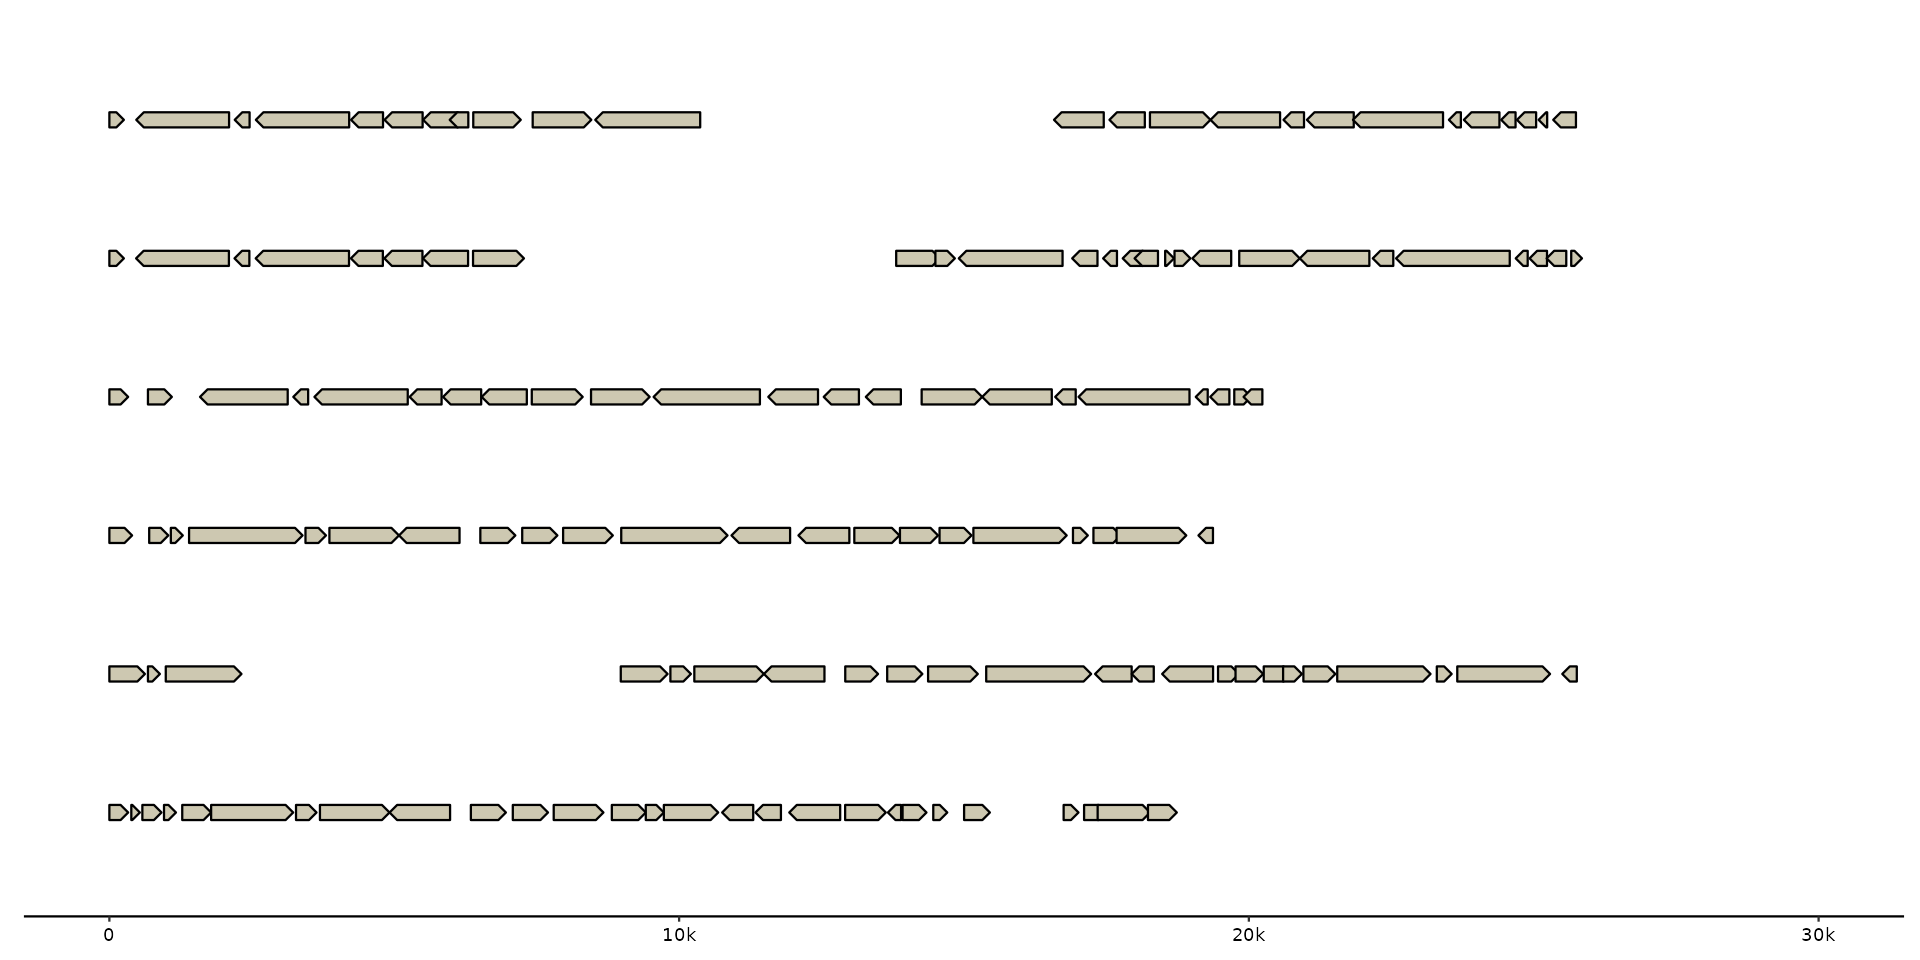
# scale_x_bp invoked by default
gggenomes(emale_genes) + geom_gene()
#> No seqs provided, inferring seqs from feats
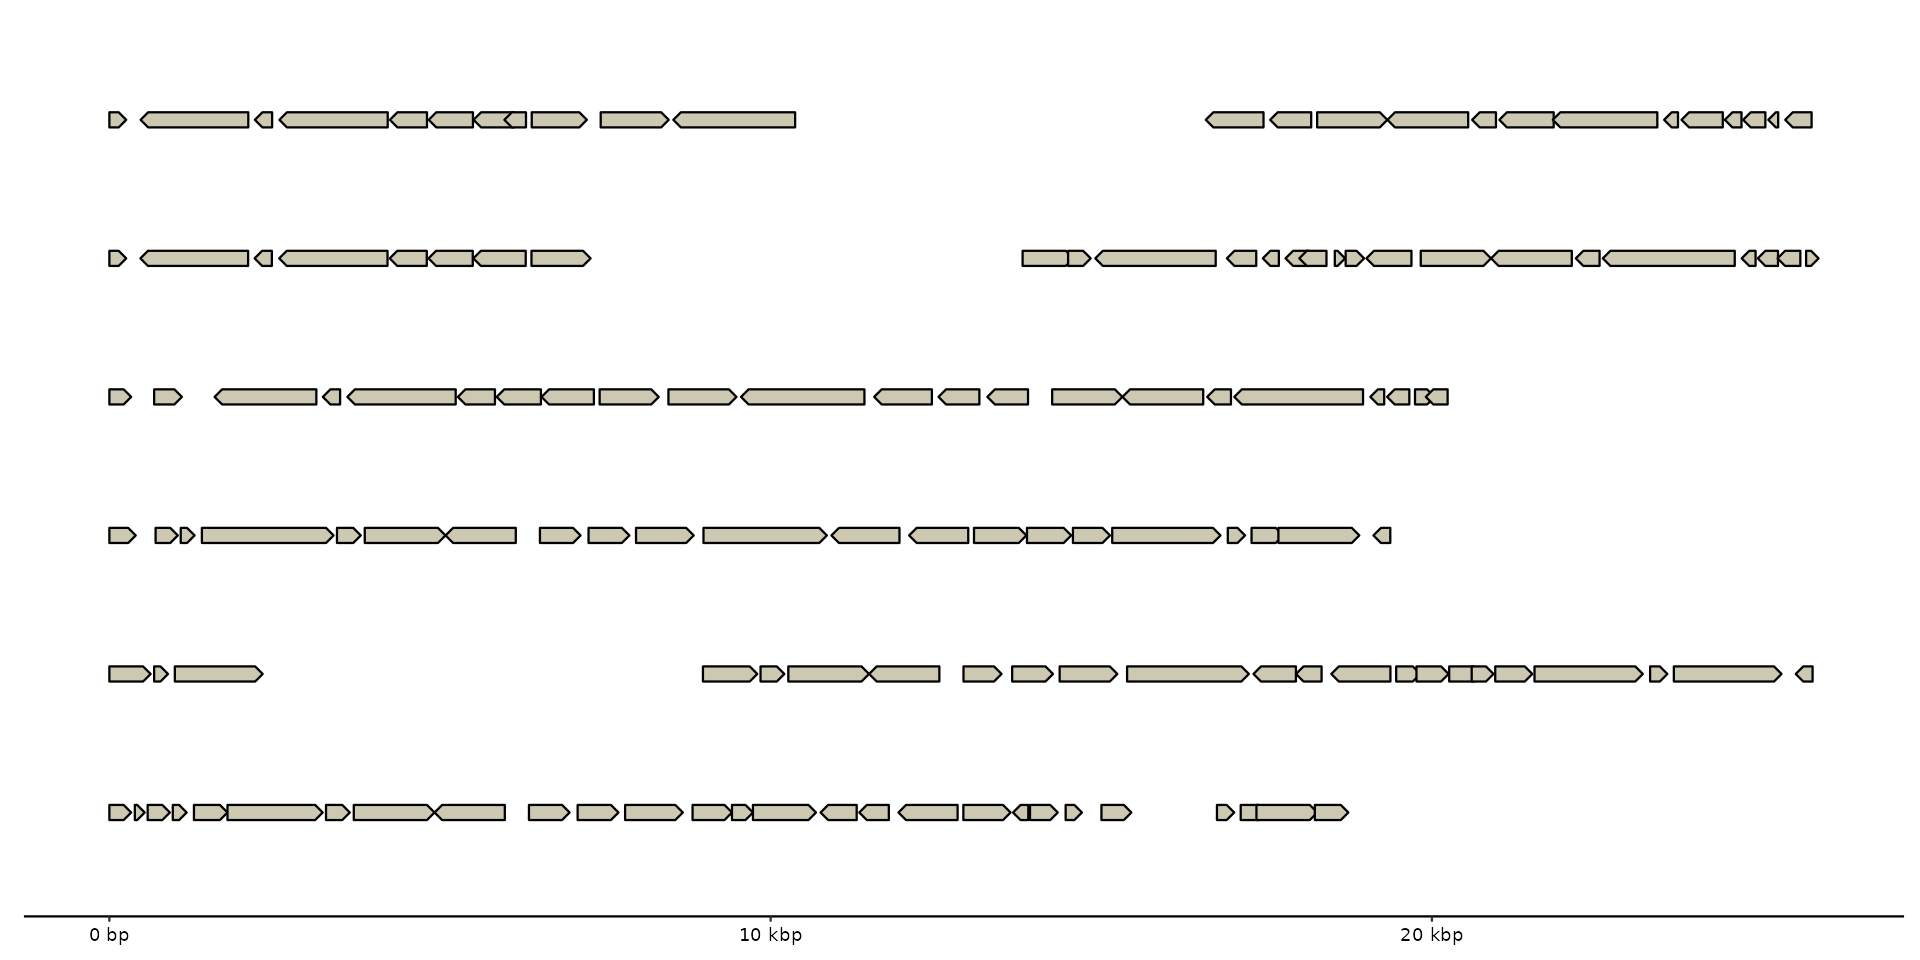
 # customize labels
gggenomes(emale_genes) + geom_gene() +
scale_x_bp(suffix = "bp", sep = " ")
#> No seqs provided, inferring seqs from feats
# customize labels
gggenomes(emale_genes) + geom_gene() +
scale_x_bp(suffix = "bp", sep = " ")
#> No seqs provided, inferring seqs from feats
 # Note: xlim will overwrite scale_x_bp() with ggplot2::scale_x_continuous()
gggenomes(emale_genes) + geom_gene() +
xlim(0, 3e4)
#> No seqs provided, inferring seqs from feats
# Note: xlim will overwrite scale_x_bp() with ggplot2::scale_x_continuous()
gggenomes(emale_genes) + geom_gene() +
xlim(0, 3e4)
#> No seqs provided, inferring seqs from feats
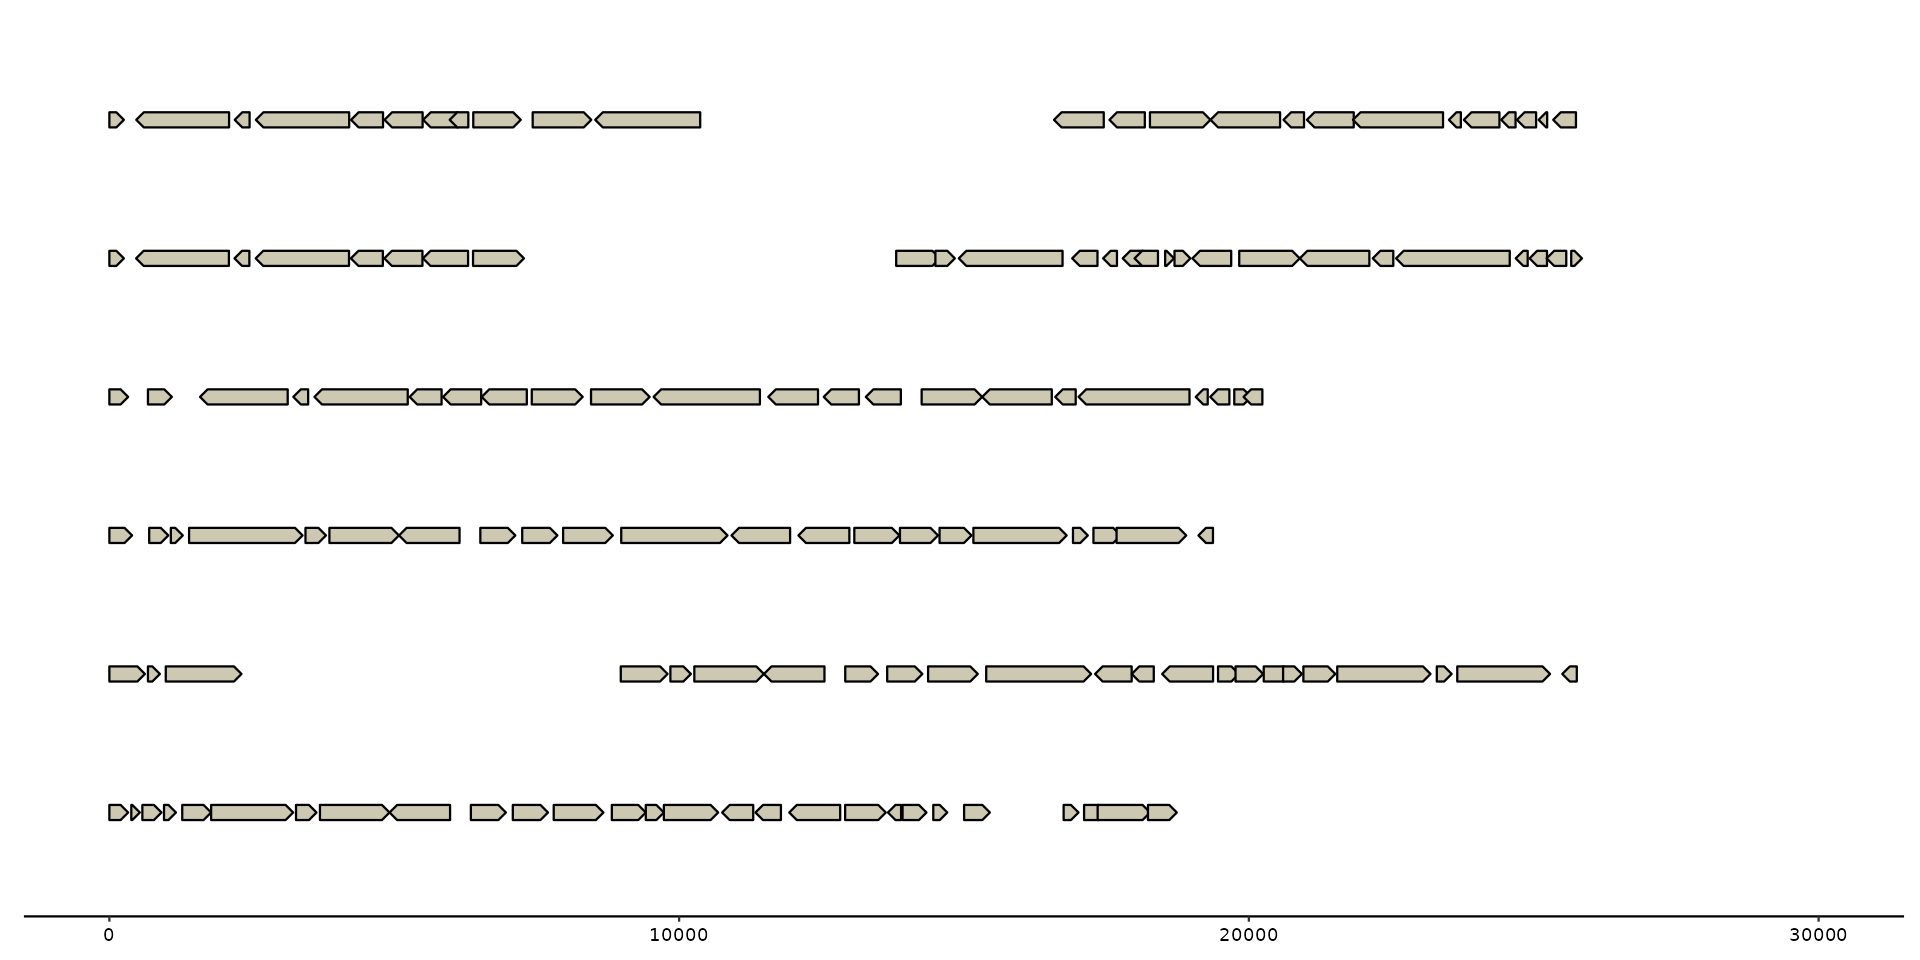 # set limits explicitly with scale_x_bp() to avoid overwrite
gggenomes(emale_genes) + geom_gene() +
scale_x_bp(limits = c(0, 3e4))
#> No seqs provided, inferring seqs from feats
# set limits explicitly with scale_x_bp() to avoid overwrite
gggenomes(emale_genes) + geom_gene() +
scale_x_bp(limits = c(0, 3e4))
#> No seqs provided, inferring seqs from feats