geom_seq() draws contigs for each sequence/chromosome supplied in the seqs track.
Several sequences belonging to the same bin will be plotted next to one another.
If seqs track is empty, sequences are inferred from the feats or links track respectively.
(The length of sequences can be deduced from the axis and is typically indicated in base pairs.)
Usage
geom_seq(mapping = NULL, data = seqs(), arrow = NULL, ...)Arguments
- mapping
Set of aesthetic mappings created by
aes(). If specified andinherit.aes = TRUE(the default), it is combined with the default mapping at the top level of the plot. You must supplymappingif there is no plot mapping.- data
seq_layout: Uses the first data frame stored in the
seqstrack, by default.- arrow
set to non-NULL to generate default arrows
- ...
Other arguments passed on to
layer()'sparamsargument. These arguments broadly fall into one of 4 categories below. Notably, further arguments to thepositionargument, or aesthetics that are required can not be passed through.... Unknown arguments that are not part of the 4 categories below are ignored.Static aesthetics that are not mapped to a scale, but are at a fixed value and apply to the layer as a whole. For example,
colour = "red"orlinewidth = 3. The geom's documentation has an Aesthetics section that lists the available options. The 'required' aesthetics cannot be passed on to theparams. Please note that while passing unmapped aesthetics as vectors is technically possible, the order and required length is not guaranteed to be parallel to the input data.When constructing a layer using a
stat_*()function, the...argument can be used to pass on parameters to thegeompart of the layer. An example of this isstat_density(geom = "area", outline.type = "both"). The geom's documentation lists which parameters it can accept.Inversely, when constructing a layer using a
geom_*()function, the...argument can be used to pass on parameters to thestatpart of the layer. An example of this isgeom_area(stat = "density", adjust = 0.5). The stat's documentation lists which parameters it can accept.The
key_glyphargument oflayer()may also be passed on through.... This can be one of the functions described as key glyphs, to change the display of the layer in the legend.
Details
geom_seq() uses ggplot2::geom_segment() under the hood. As a result,
different aesthetics such as alpha, linewidth, color, etc.
can be called upon to modify the visualization of the data.
Note: The seqs track indicates the length/region of the sequence/contigs that will be plotted.
Feats or links data that falls outside of this region are ignored!
Examples
# Simple example of geom_seq
gggenomes(seqs = emale_seqs) +
geom_seq() + # creates contigs
geom_bin_label() # labels bins/sequences
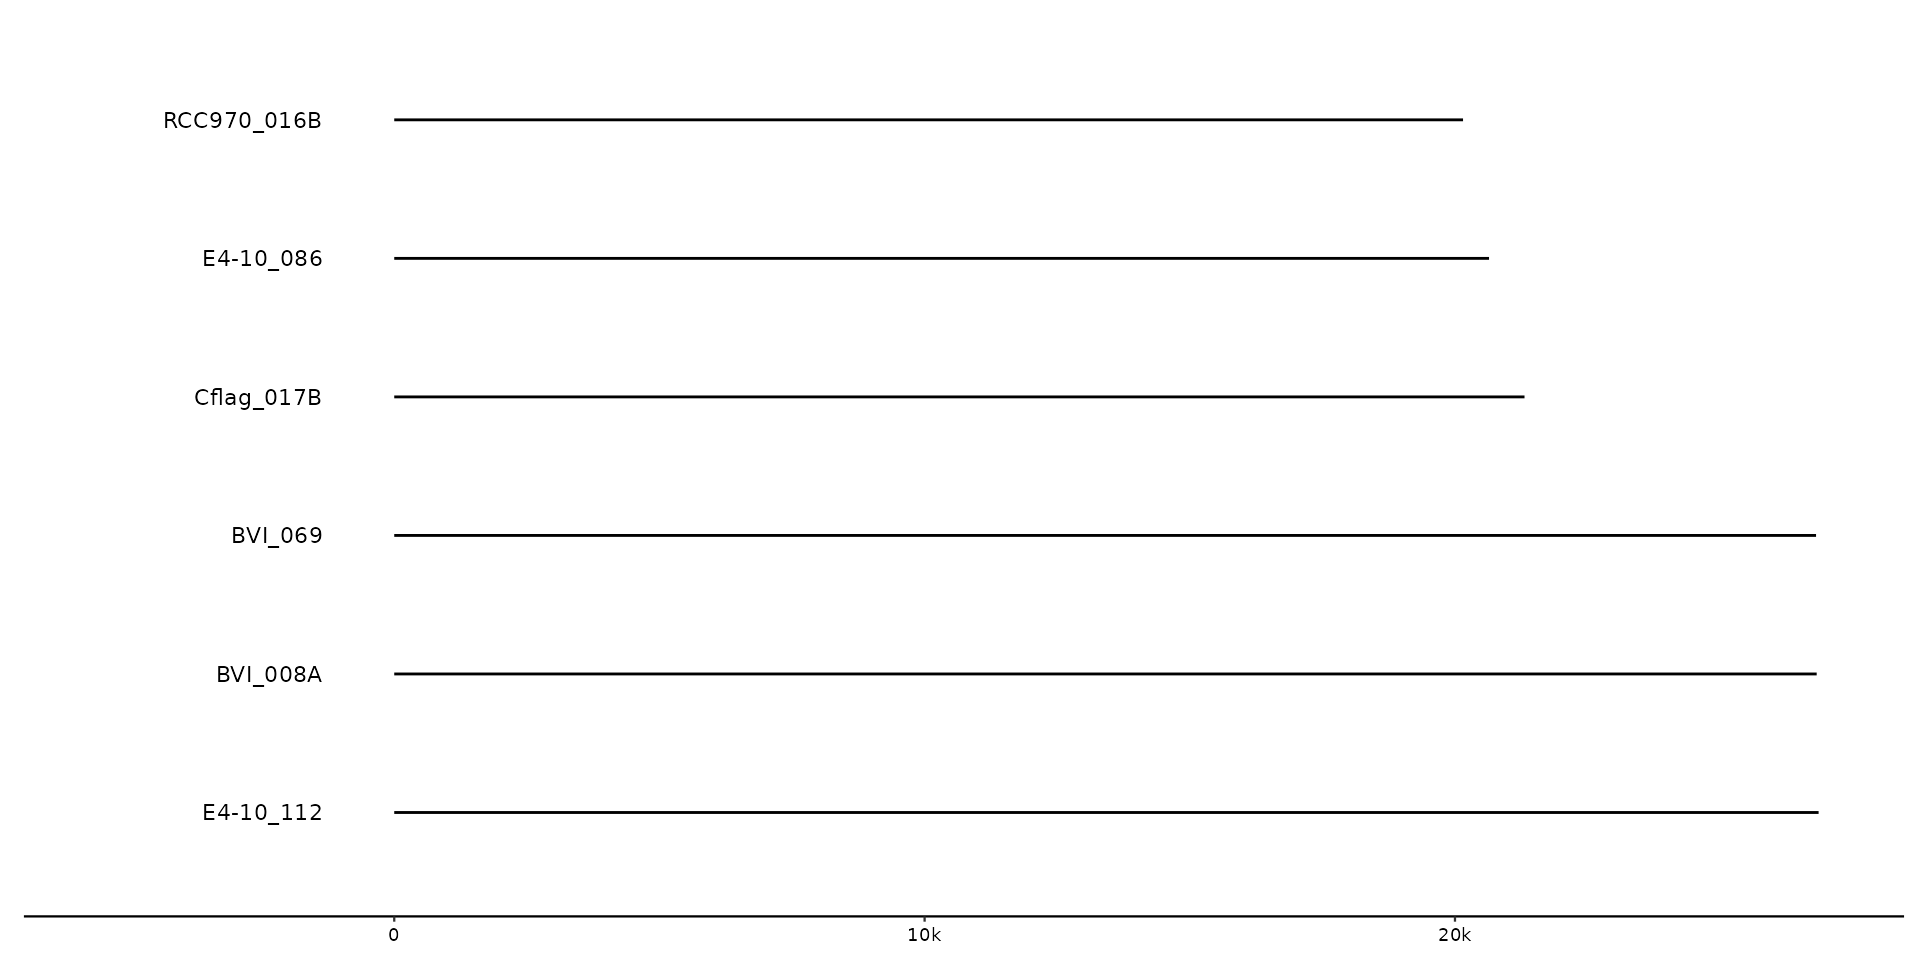 # No sequence information supplied, will inform/warn that seqs are inferred from feats.
gggenomes(genes = emale_genes) +
geom_seq() + # creates contigs
geom_gene() + # draws genes on top of contigs
geom_bin_label() # labels bins/sequences
#> No seqs provided, inferring seqs from feats
# No sequence information supplied, will inform/warn that seqs are inferred from feats.
gggenomes(genes = emale_genes) +
geom_seq() + # creates contigs
geom_gene() + # draws genes on top of contigs
geom_bin_label() # labels bins/sequences
#> No seqs provided, inferring seqs from feats
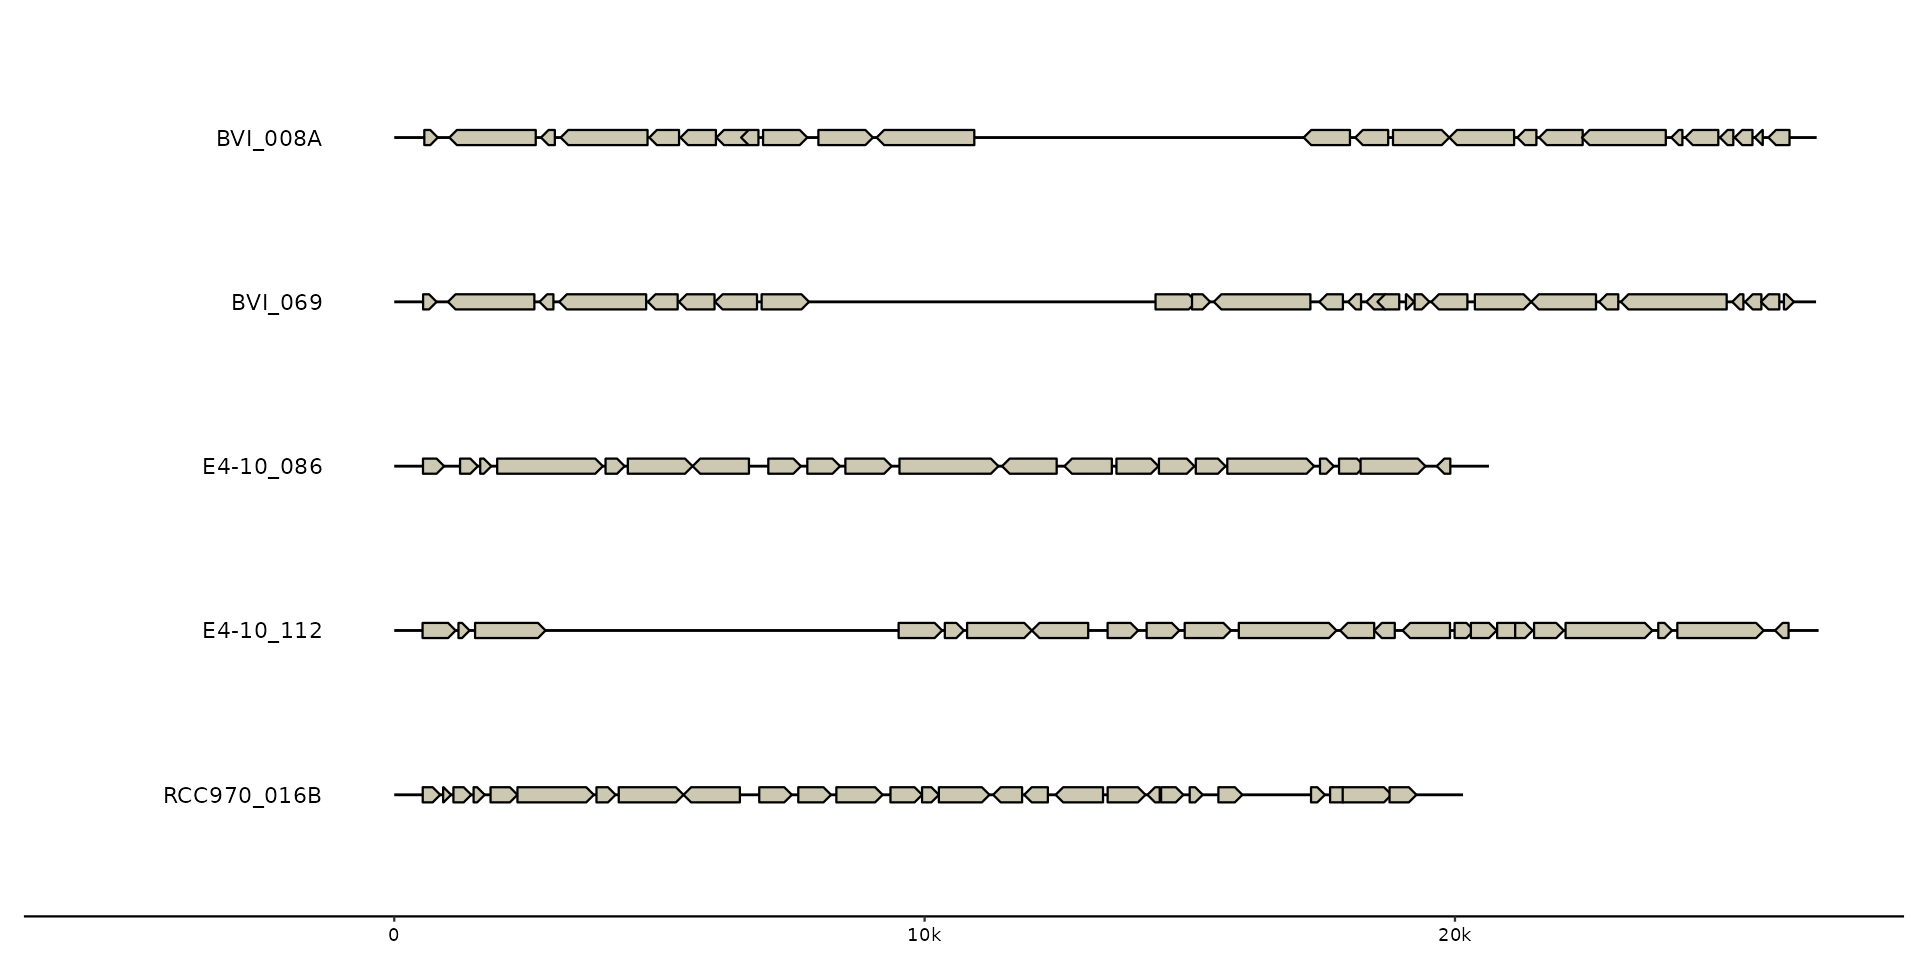
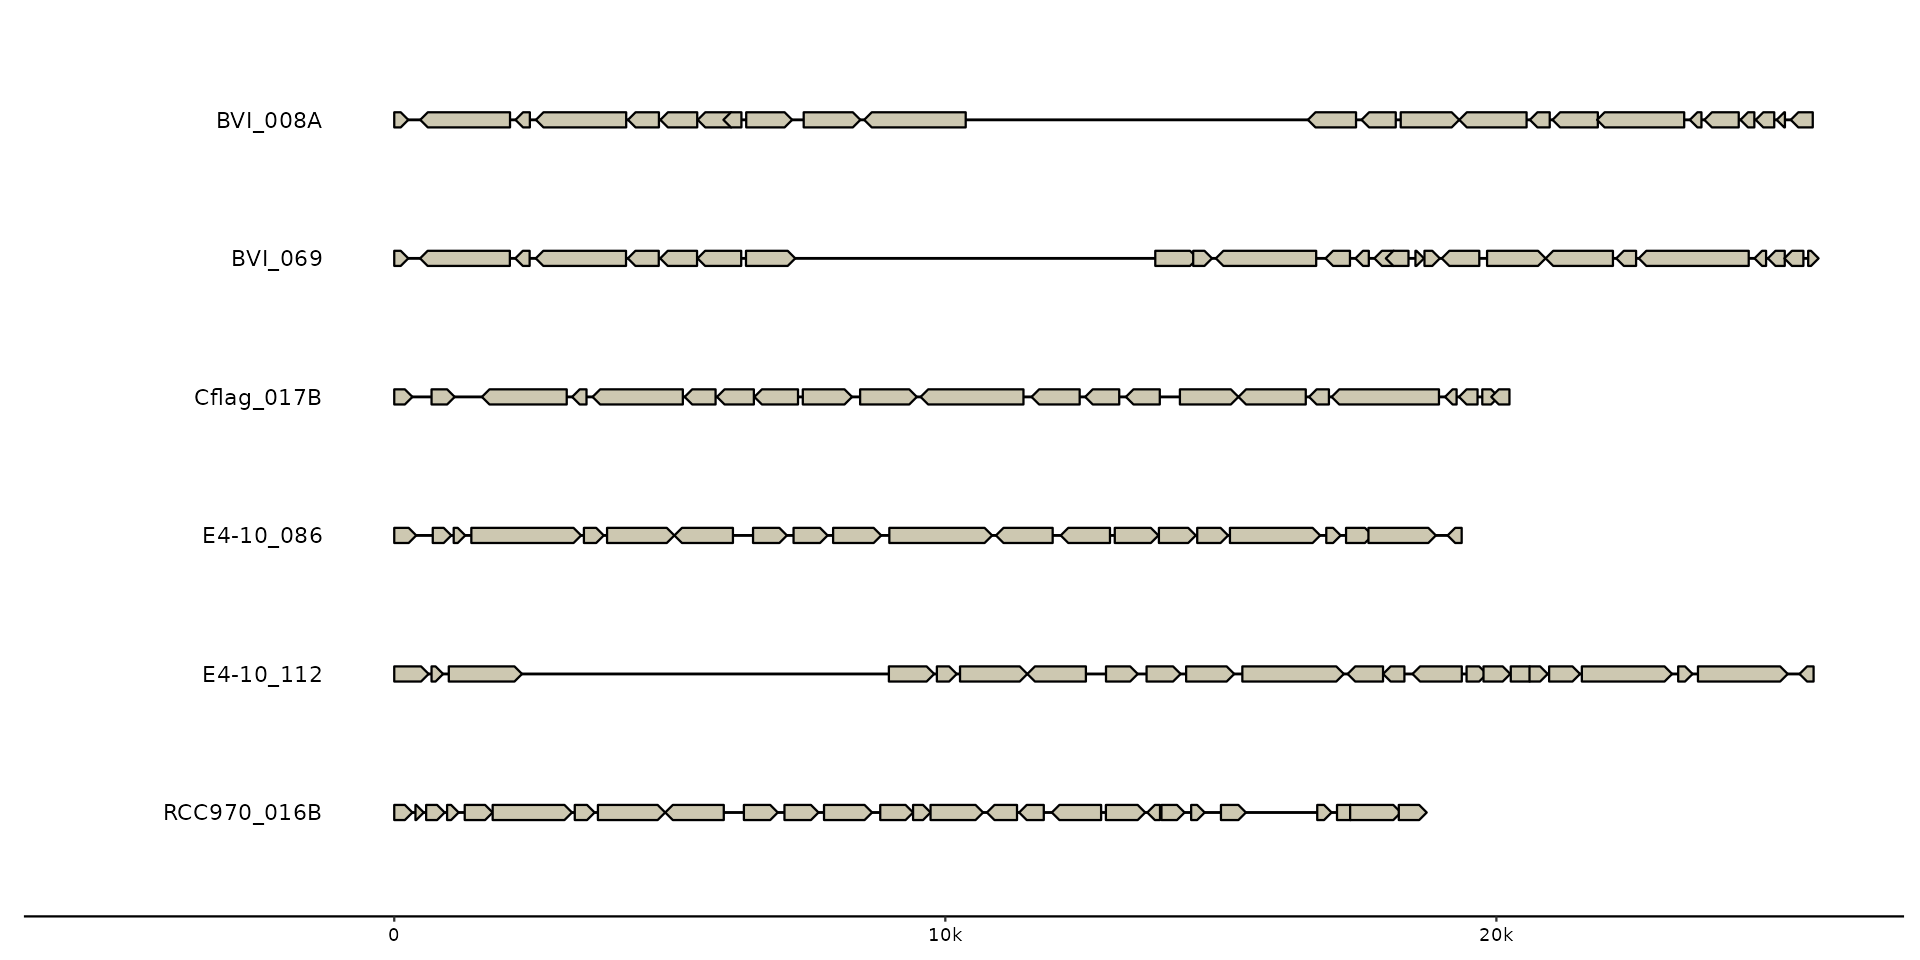 # Sequence data controls what sequences and/or regions will be plotted.
# Here one sequence is filtered out, Notice that the genes of the removed
# sequence are silently ignored and thus not plotted.
missing_seqs <- emale_seqs |>
dplyr::filter(seq_id != "Cflag_017B") |>
dplyr::arrange(seq_id) # `arrange` to restore alphabetical order.
gggenomes(seqs = missing_seqs, genes = emale_genes) +
geom_seq() + # creates contigs
geom_gene() + # draws genes on top of contigs
geom_bin_label() # labels bins/sequences
# Sequence data controls what sequences and/or regions will be plotted.
# Here one sequence is filtered out, Notice that the genes of the removed
# sequence are silently ignored and thus not plotted.
missing_seqs <- emale_seqs |>
dplyr::filter(seq_id != "Cflag_017B") |>
dplyr::arrange(seq_id) # `arrange` to restore alphabetical order.
gggenomes(seqs = missing_seqs, genes = emale_genes) +
geom_seq() + # creates contigs
geom_gene() + # draws genes on top of contigs
geom_bin_label() # labels bins/sequences
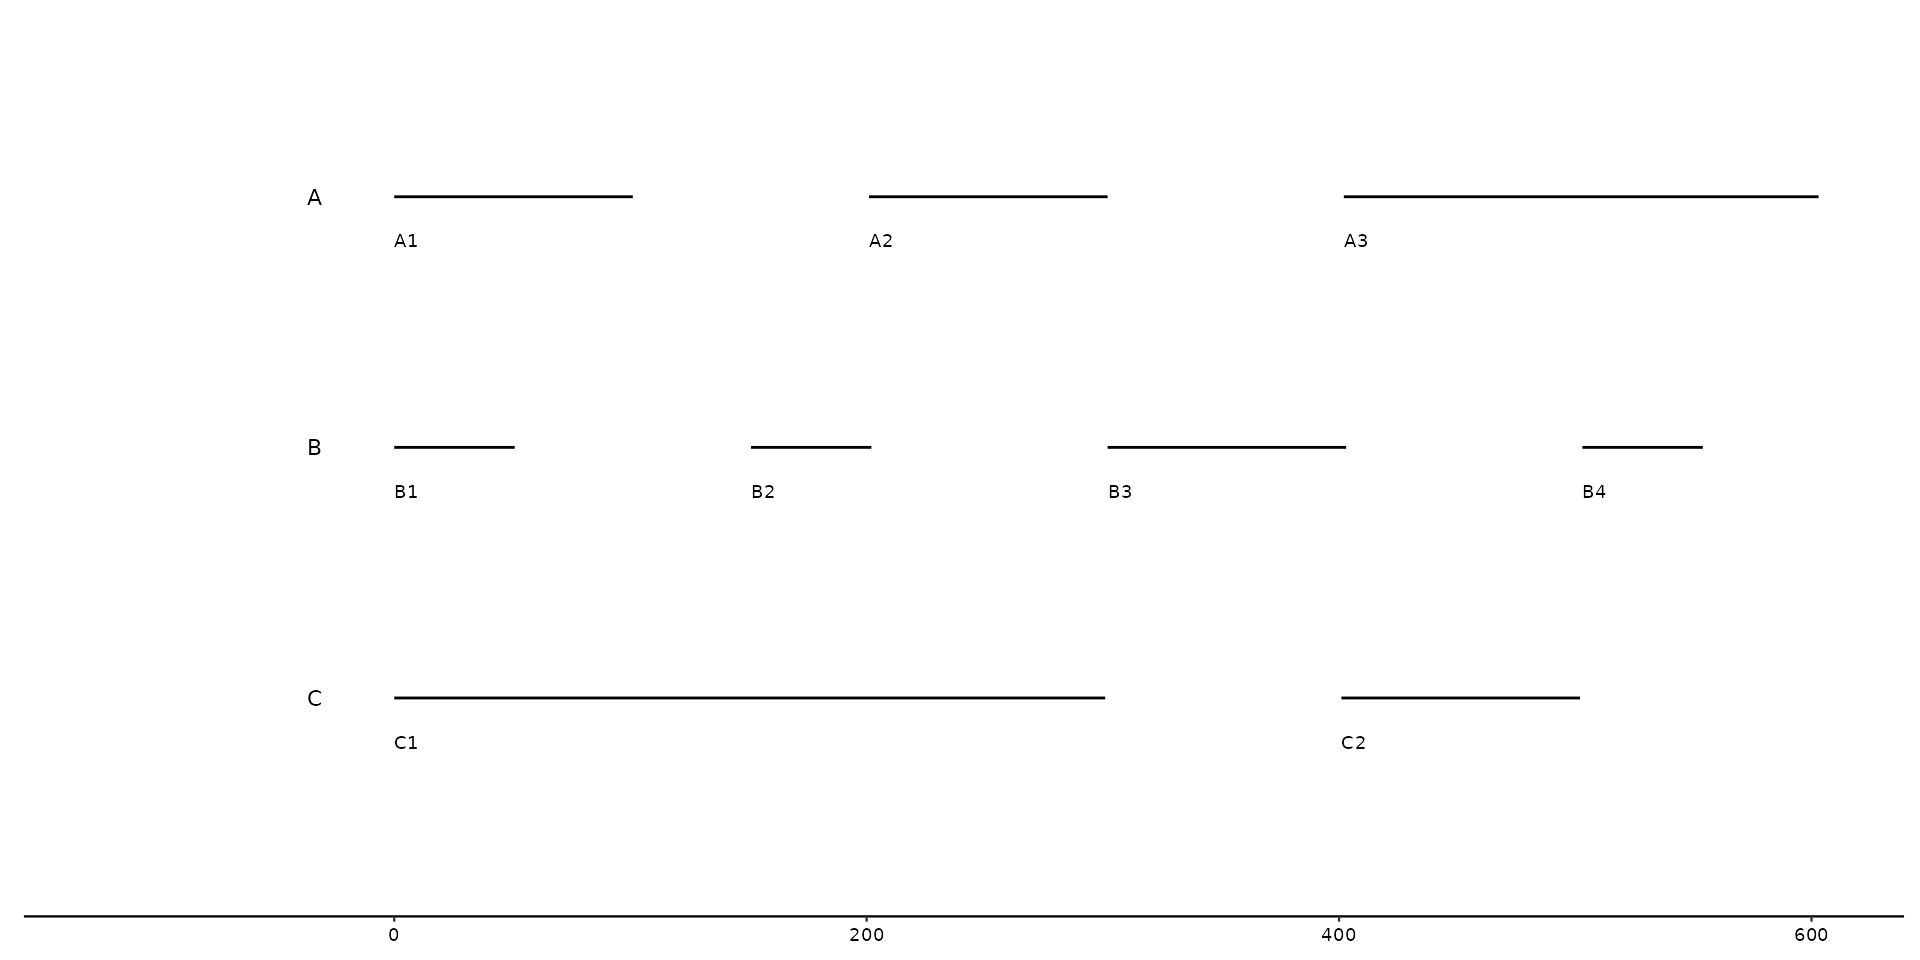
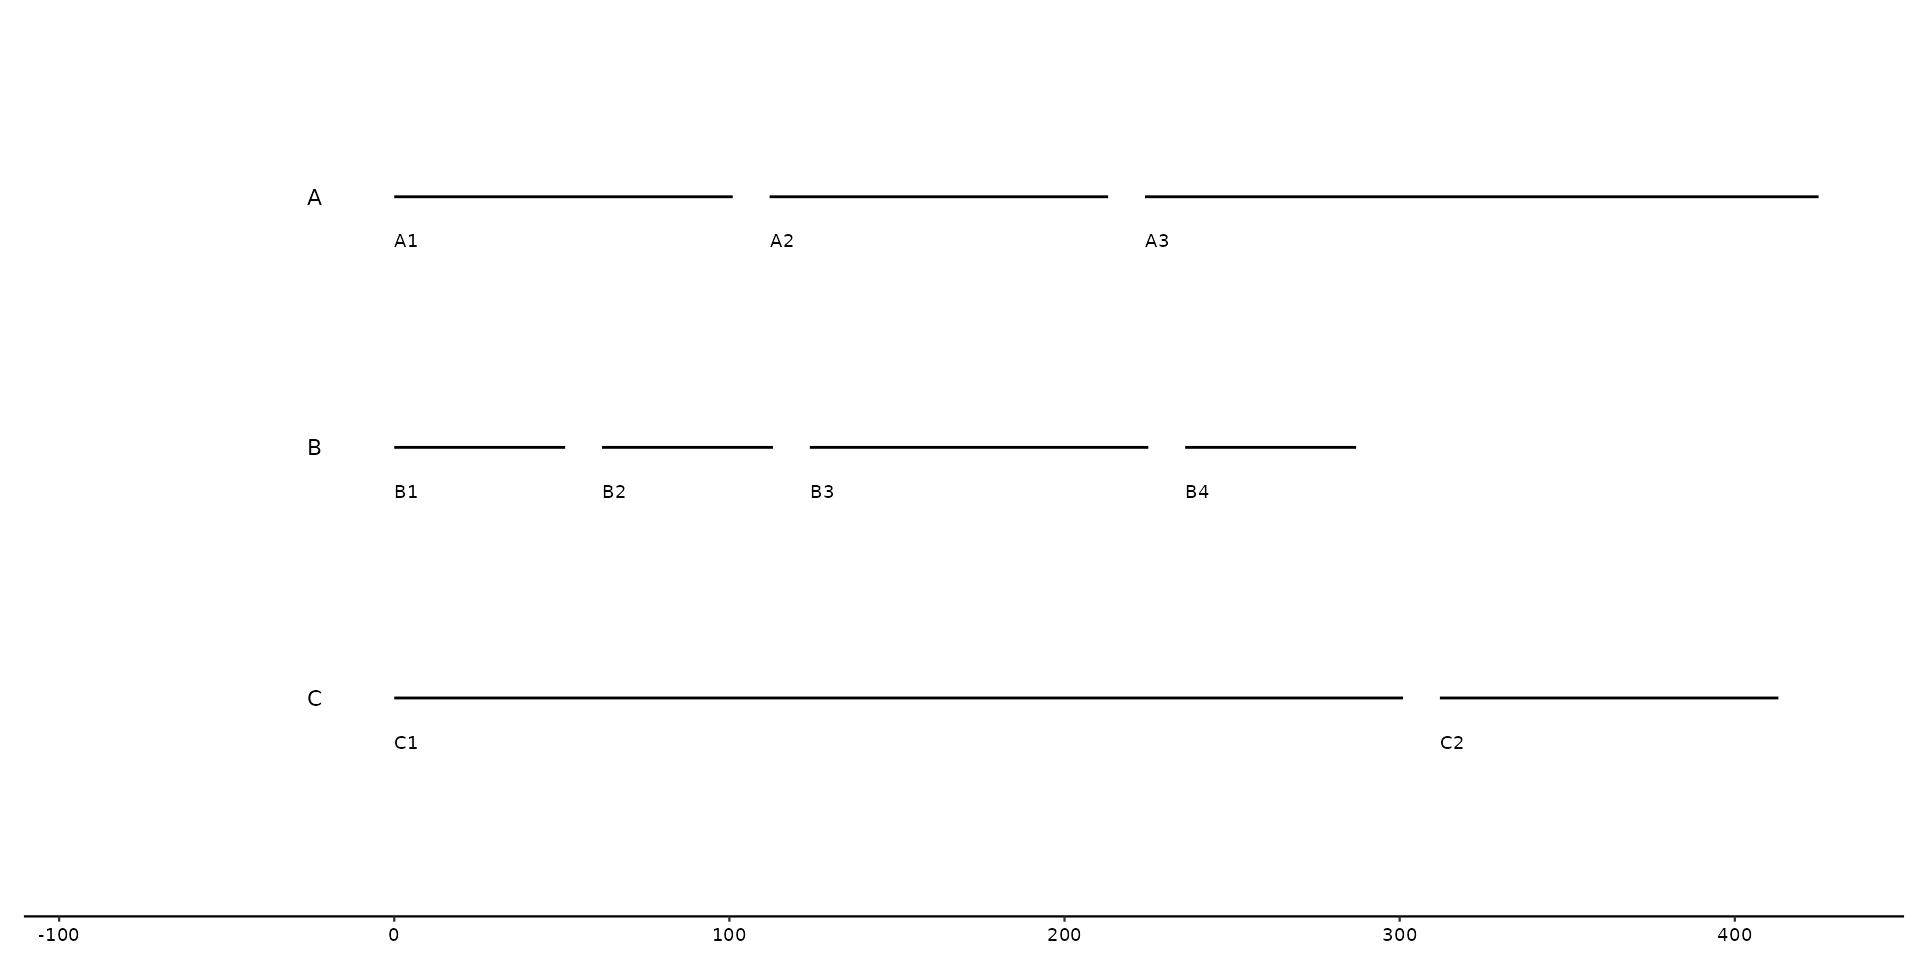
 # Several sequences belonging to the same *bin* are plotted next to one another
seqs <- tibble::tibble(
bin_id = c("A", "A", "A", "B", "B", "B", "B", "C", "C"),
seq_id = c("A1", "A2", "A3", "B1", "B2", "B3", "B4", "C1", "C2"),
start = c(0, 100, 200, 0, 50, 150, 250, 0, 400),
end = c(100, 200, 400, 50, 100, 250, 300, 300, 500),
length = c(100, 100, 200, 50, 50, 100, 50, 300, 100)
)
gggenomes(seqs = seqs) +
geom_seq() +
geom_bin_label() + # label bins
geom_seq_label() # label individual sequences
# Several sequences belonging to the same *bin* are plotted next to one another
seqs <- tibble::tibble(
bin_id = c("A", "A", "A", "B", "B", "B", "B", "C", "C"),
seq_id = c("A1", "A2", "A3", "B1", "B2", "B3", "B4", "C1", "C2"),
start = c(0, 100, 200, 0, 50, 150, 250, 0, 400),
end = c(100, 200, 400, 50, 100, 250, 300, 300, 500),
length = c(100, 100, 200, 50, 50, 100, 50, 300, 100)
)
gggenomes(seqs = seqs) +
geom_seq() +
geom_bin_label() + # label bins
geom_seq_label() # label individual sequences
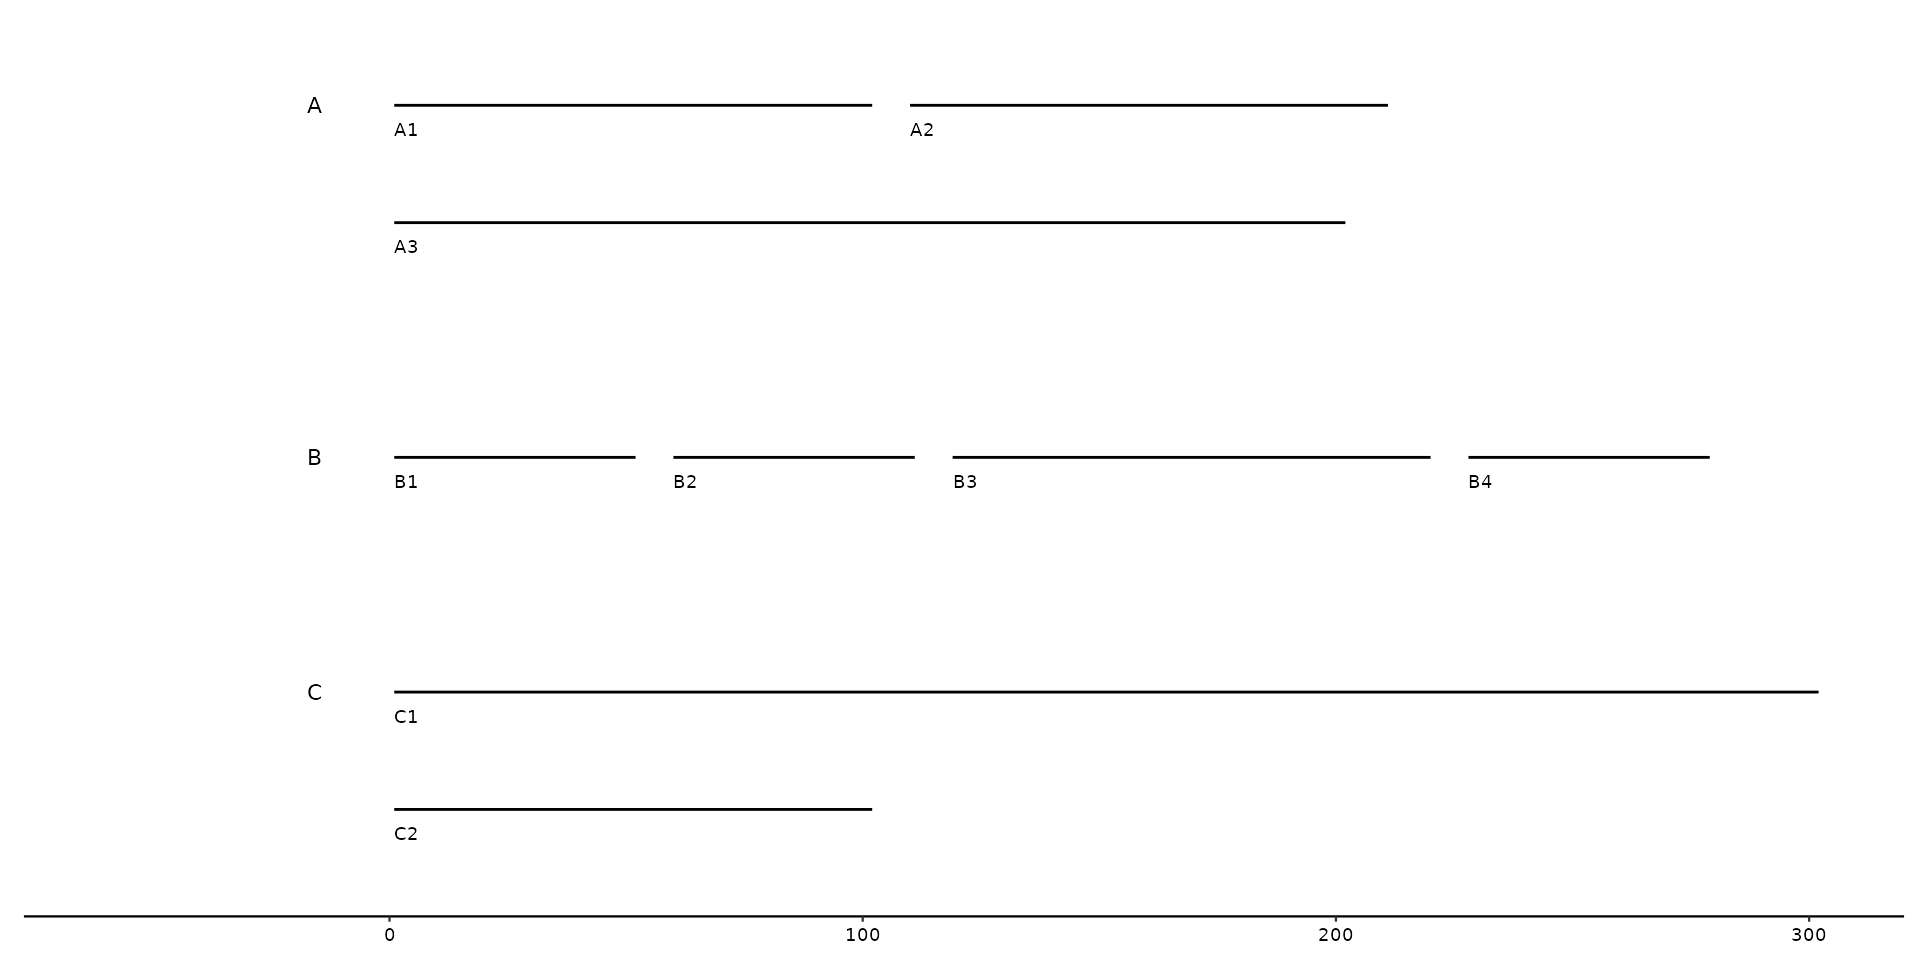
 # Wrap bins uptill a certain amount.
gggenomes(seqs = seqs, wrap = 300) +
geom_seq() +
geom_bin_label() + # label bins
geom_seq_label() # label individual sequences
# Wrap bins uptill a certain amount.
gggenomes(seqs = seqs, wrap = 300) +
geom_seq() +
geom_bin_label() + # label bins
geom_seq_label() # label individual sequences
 # Change the space between sequences belonging to one bin
gggenomes(seqs = seqs, spacing = 100) +
geom_seq() +
geom_bin_label() + # label bins
geom_seq_label() # label individual sequences
# Change the space between sequences belonging to one bin
gggenomes(seqs = seqs, spacing = 100) +
geom_seq() +
geom_bin_label() + # label bins
geom_seq_label() # label individual sequences