Pick which bins and seqs to show and in what order. Uses
dplyr::select()-like syntax, which means unquoted genome names, positional
arguments and selection helpers, such as
tidyselect::starts_with() are supported. Renaming is not supported.
Usage
pick(x, ...)

pick_seqs(x, ..., .bins = everything())

pick_seqs_within(x, ..., .bins = everything())

pick_by_tree(x, tree, infer_bin_id = .data$label)
Arguments
- x
gggenomes object
- ...
bins/seqs to pick, select-like expression.
- .bins
scope for positional arguments, select-like expression, enclose multiple arguments with
c()!- tree
a phylogenetic tree in ggtree::ggtree or
ape::ape-package-"phylo" format.- infer_bin_id
an expression to extract bin_ids from the tree data.
Value
gggenomes object with selected bins and seqs.
gggenomes object with selected seqs.
gggenomes object with selected seqs.
gggenomes object with seqs selected by tree order.
Details
Use the dots to select bins or sequences (depending on function suffix), and
the .bins argument to set the scope for positional arguments. For example,
pick_seqs(1) will pick the first sequence from the first bin, while
pick_seqs(1, .bins=3) will pick the first sequence from the third bin.
Functions
pick(): pick bins by bin_id, positional argument (start at top) or select-helper.pick_seqs(): pick individual seqs seq_id, positional argument (start at top left) or select-helper.pick_seqs_within(): pick individual seqs but only modify bins containing those seqs, keep rest as is.pick_by_tree(): align bins with the leaves in a given phylogenetic tree.
Examples
s0 <- tibble::tibble(
bin_id = c("A", "B", "B", "B", "C", "C", "C"),
seq_id = c("a1", "b1", "b2", "b3", "c1", "c2", "c3"),
length = c(1e4, 6e3, 2e3, 1e3, 3e3, 3e3, 3e3)
)
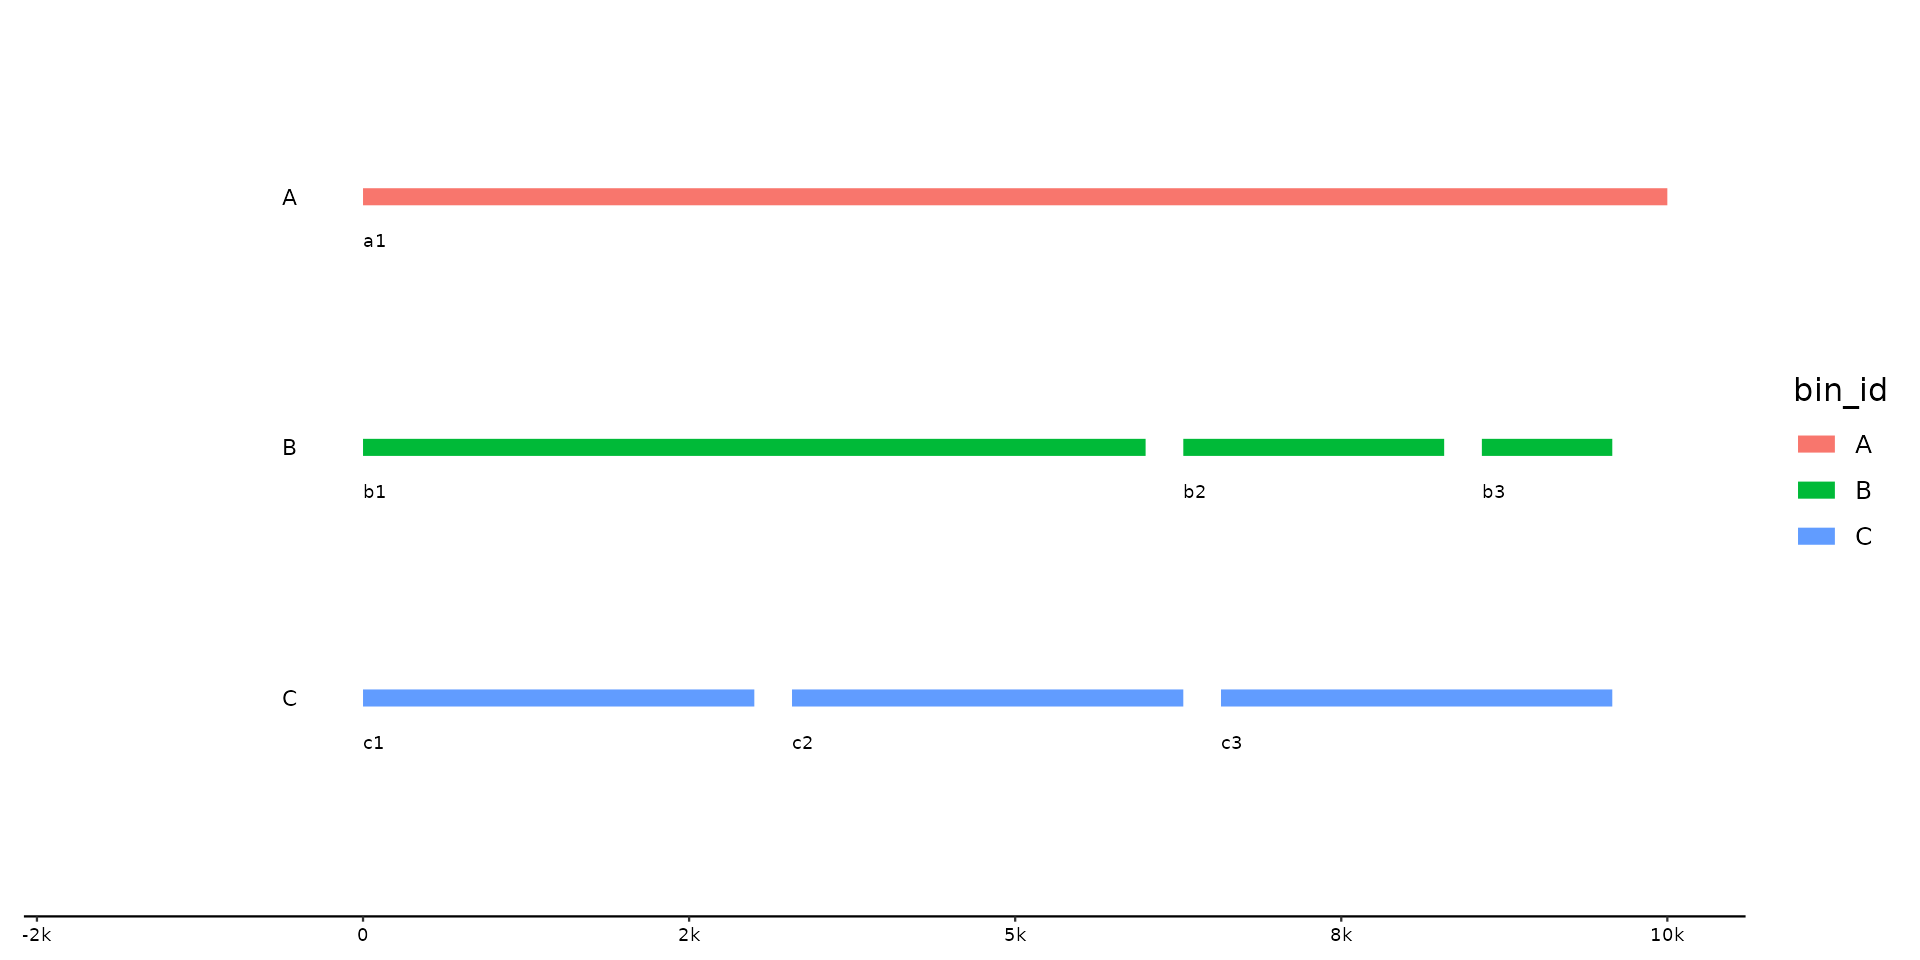
p <- gggenomes(seqs = s0) + geom_seq(aes(color = bin_id), linewidth = 3) +
geom_bin_label() + geom_seq_label() +
expand_limits(color = c("A", "B", "C"))
p
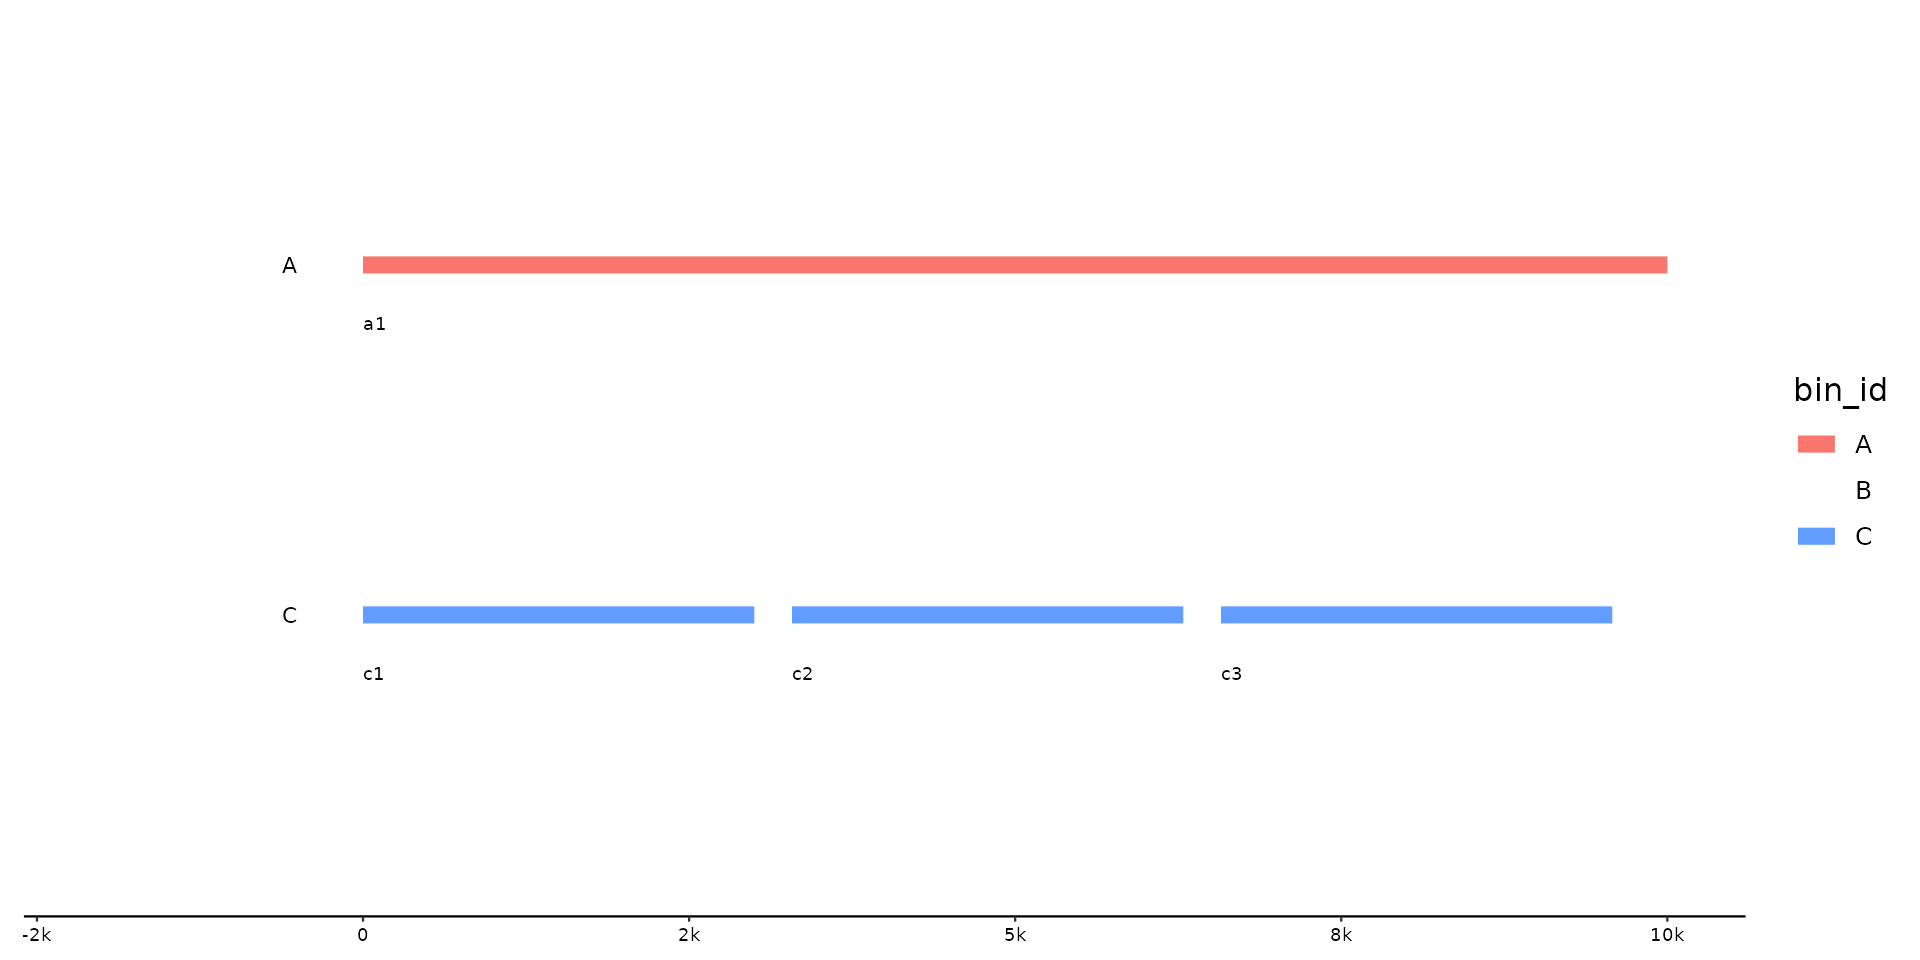
 # remove
p %>% pick(-B)
# remove
p %>% pick(-B)
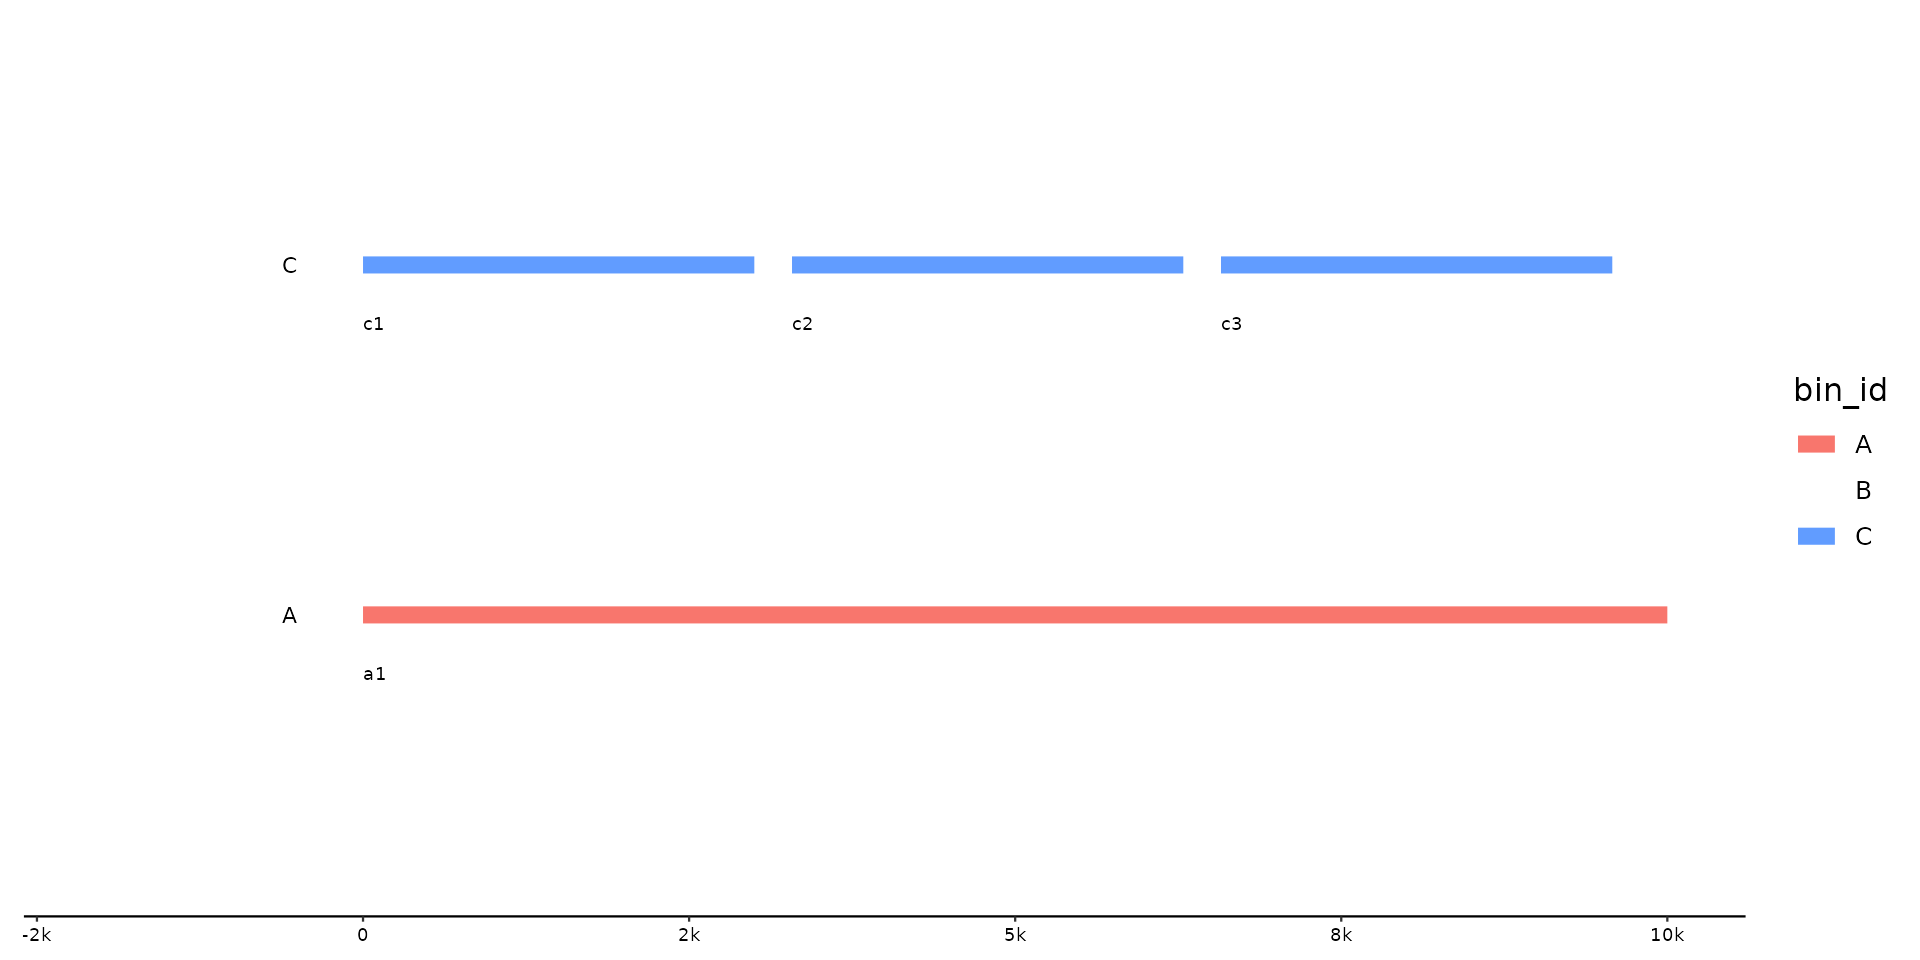
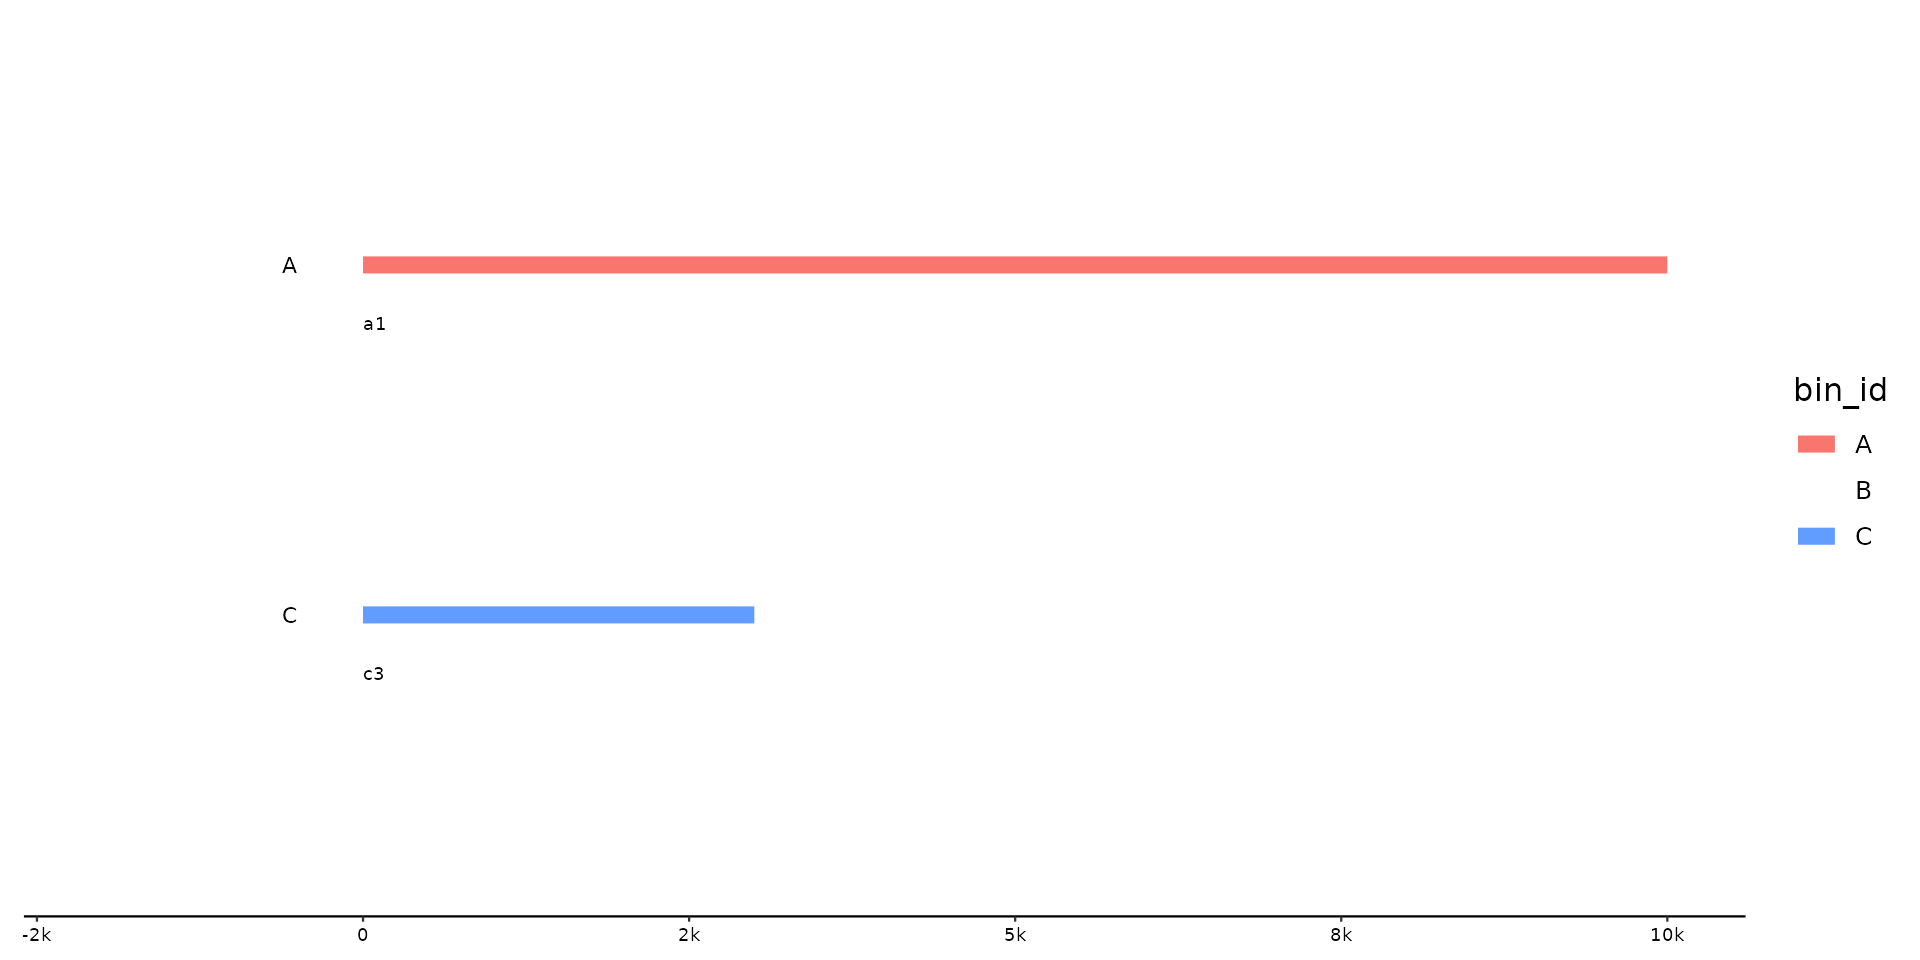
 # select and reorder, by ID and position
p %>% pick(C, 1)
# select and reorder, by ID and position
p %>% pick(C, 1)
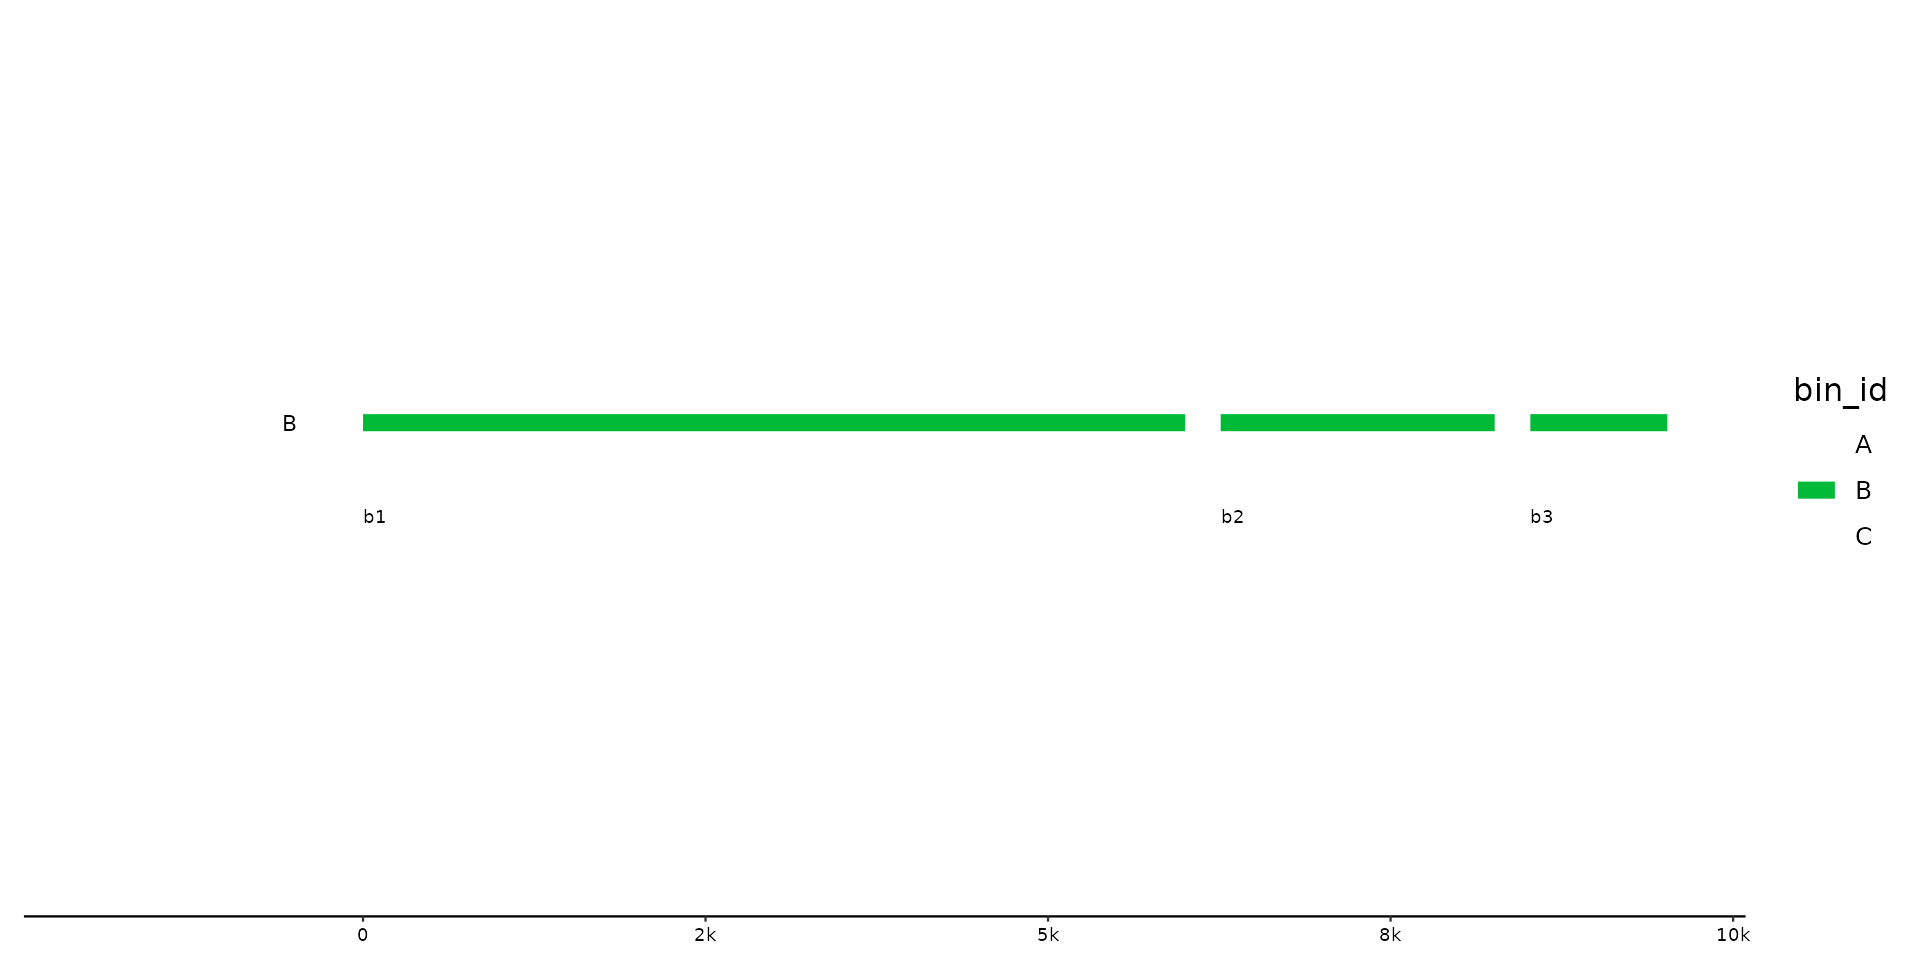
 # use helper function
p %>% pick(starts_with("B"))
# use helper function
p %>% pick(starts_with("B"))
 # pick just some seqs
p %>% pick_seqs(1, c3)
# pick just some seqs
p %>% pick_seqs(1, c3)
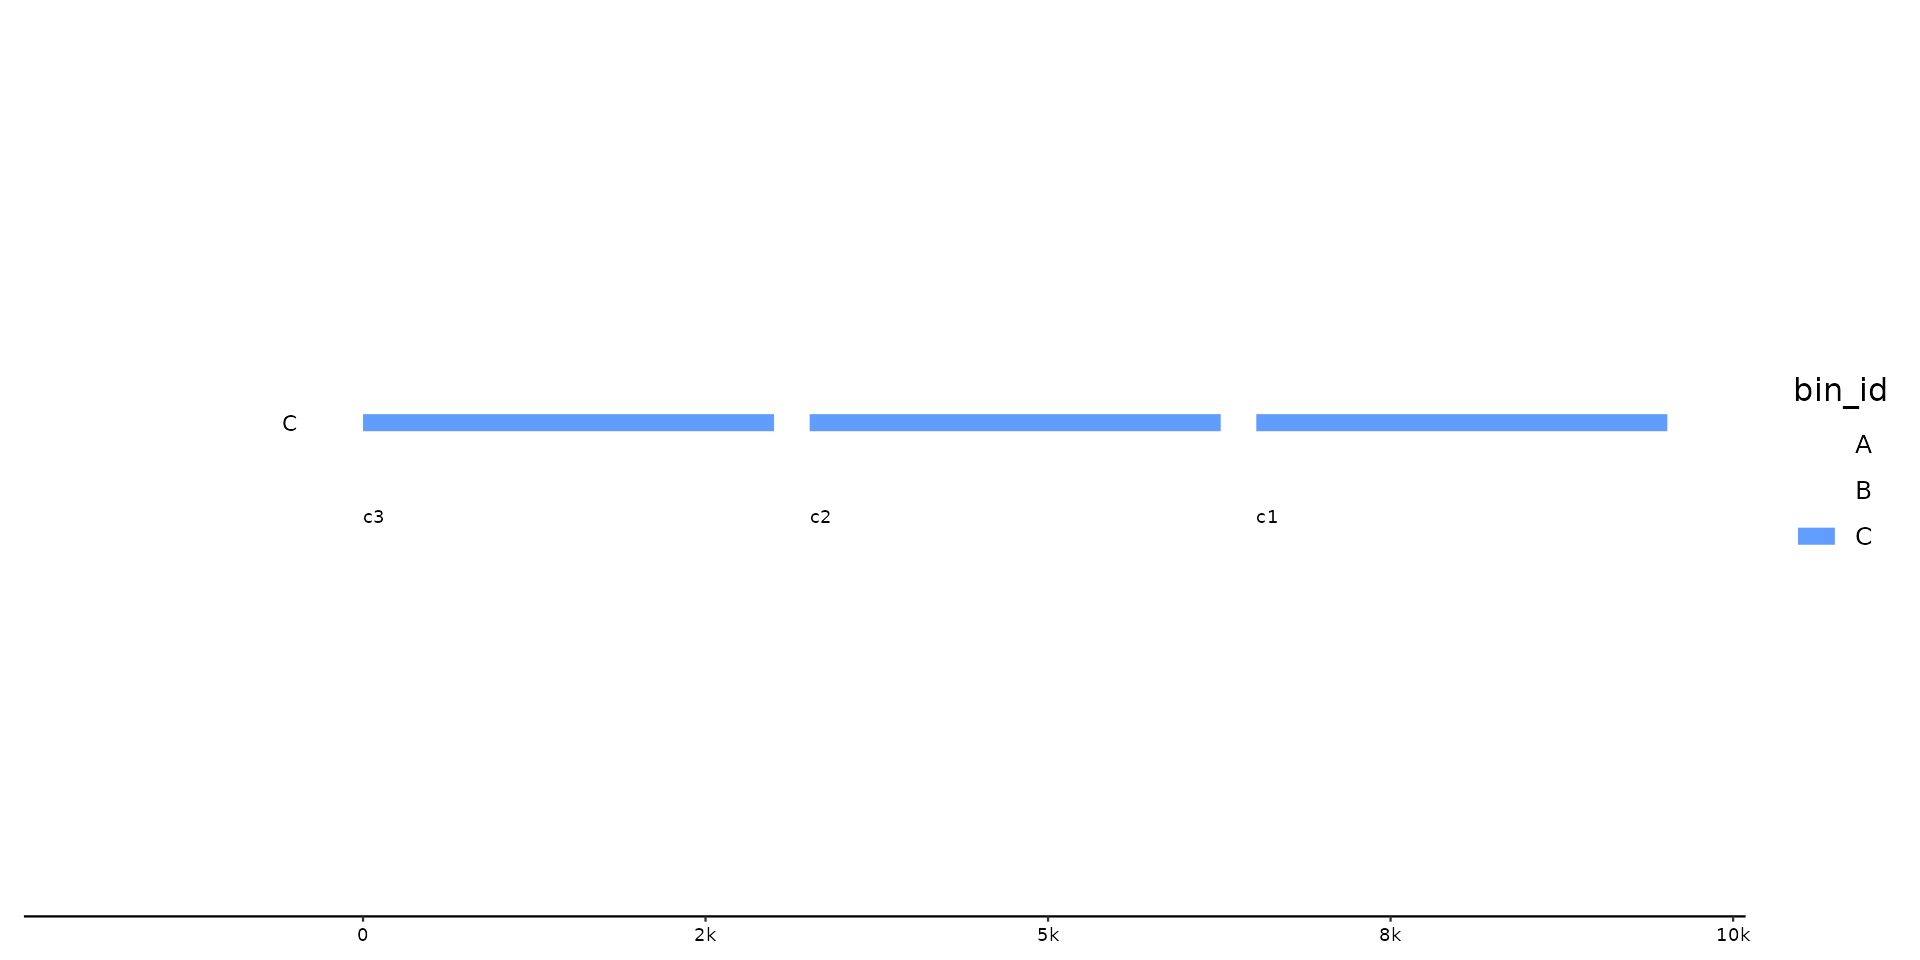
 # pick with .bin scope
p %>% pick_seqs(3:1, .bins = C)
# pick with .bin scope
p %>% pick_seqs(3:1, .bins = C)
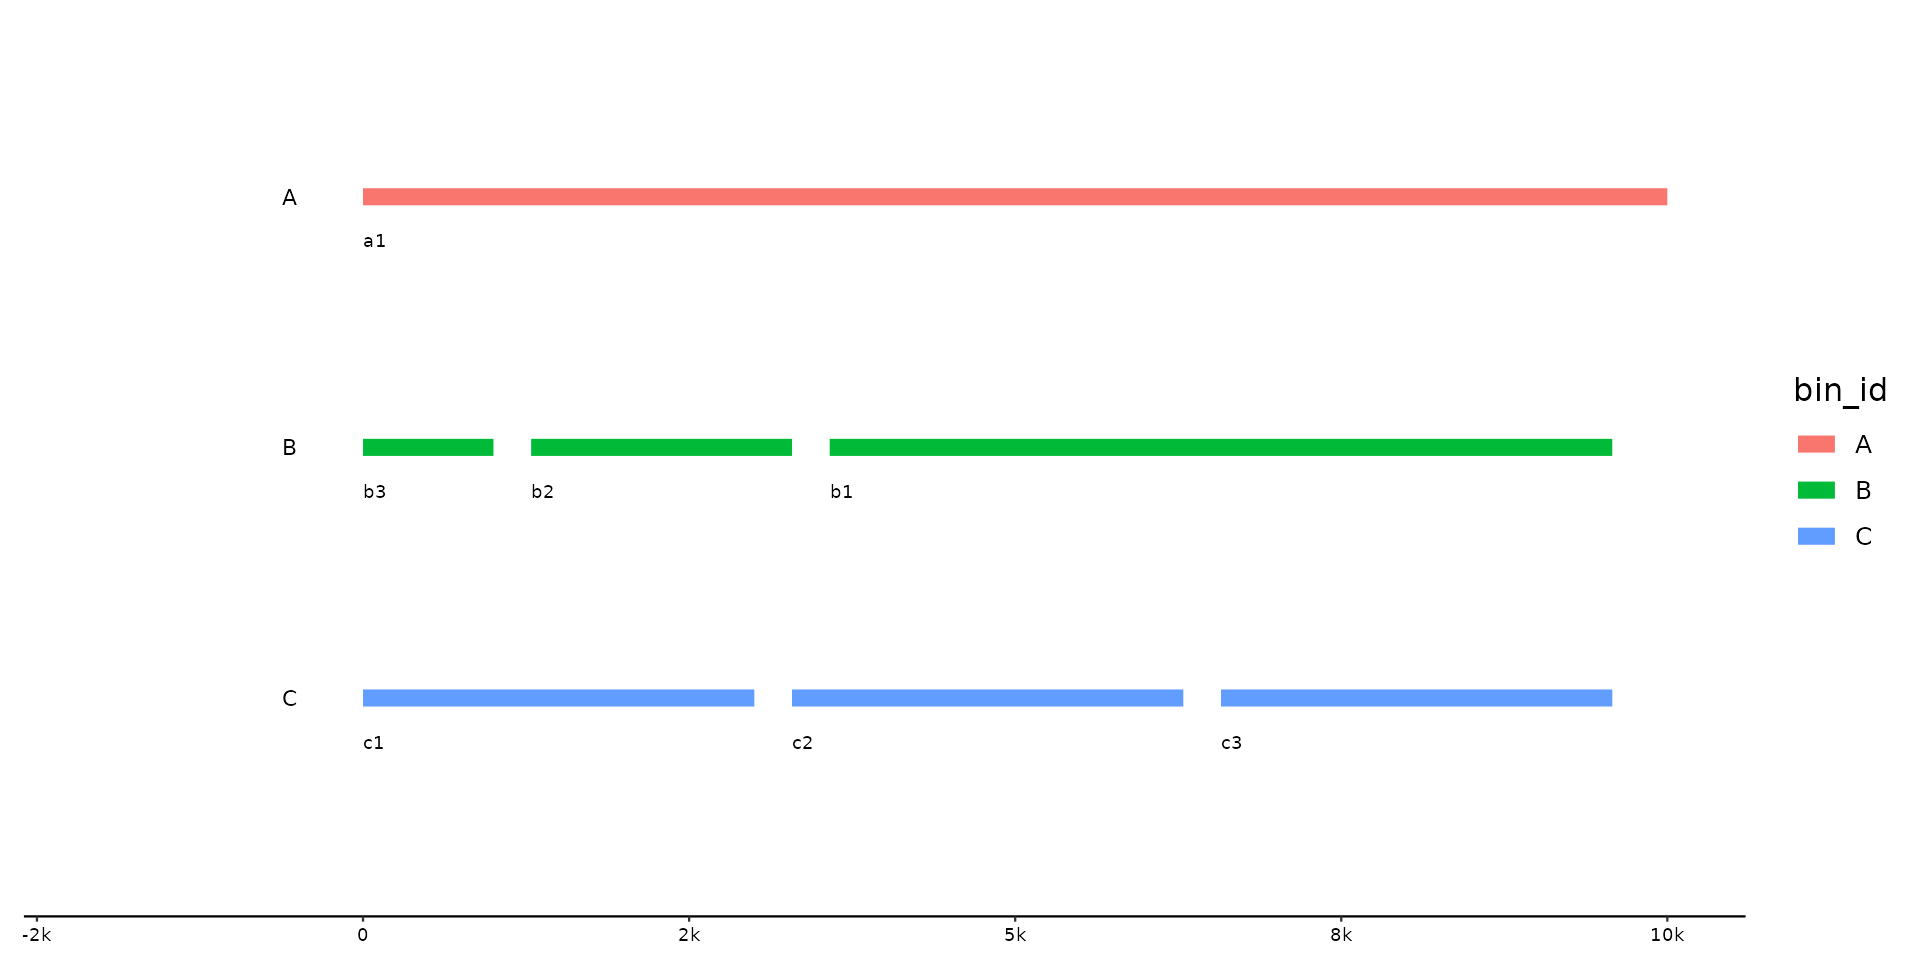
 # change seqs in some bins, but keep rest as is
p %>% pick_seqs_within(3:1, .bins = B)
# change seqs in some bins, but keep rest as is
p %>% pick_seqs_within(3:1, .bins = B)
 # same w/o scope, unaffected bins remain as is
p %>% pick_seqs_within(b3, b2, b1)
# same w/o scope, unaffected bins remain as is
p %>% pick_seqs_within(b3, b2, b1)
 try({ # can fail on older systems with older ggtree versions
# Align sequences with and plot next to a phylogenetic tree
library(patchwork) # arrange multiple plots
library(ggtree) # plot phylogenetic trees
# load and plot a phylogenetic tree
emale_mcp_tree <- read.tree(ex("emales/emales-MCP.nwk"))
t <- ggtree(emale_mcp_tree) + geom_tiplab(align = TRUE, size = 3) +
xlim(0, 0.05) # make room for labels
p <- gggenomes(seqs = emale_seqs, genes = emale_genes) +
geom_seq() + geom_seq() + geom_bin_label()
# plot next to each other, but with
# different order in tree and genomes
t + p + plot_layout(widths = c(1, 5))
# reorder genomes to match tree order
# with a warning caused by mismatch in y-scale expansions
t + p %>% pick_by_tree(t) + plot_layout(widths = c(1, 5))
# extra genomes are dropped with a notification
emale_seqs_more <- emale_seqs
emale_seqs_more[7, ] <- emale_seqs_more[6, ]
emale_seqs_more$seq_id[7] <- "One more genome"
p <- gggenomes(seqs = emale_seqs_more, genes = emale_genes) +
geom_seq() + geom_seq() + geom_bin_label()
t + p %>% pick_by_tree(t) + plot_layout(widths = c(1, 5))
# no shared ids will cause an error
p <- gggenomes(seqs = tibble::tibble(seq_id = "foo", length = 1)) +
geom_seq() + geom_seq() + geom_bin_label()
t + p %>% pick_by_tree(t) + plot_layout(widths = c(1, 5))
# extra leafs in tree will cause an error
emale_seqs_fewer <- slice_head(emale_seqs, n = 4)
p <- gggenomes(seqs = emale_seqs_fewer, genes = emale_genes) +
geom_seq() + geom_seq() + geom_bin_label()
t + p %>% pick_by_tree(t) + plot_layout(widths = c(1, 5))
})
#> ggtree v4.0.4 Learn more at https://yulab-smu.top/contribution-tree-data/
#>
#> Please cite:
#>
#> Guangchuang Yu. Data Integration, Manipulation and Visualization of
#> Phylogenetic Trees (1st edition). Chapman and Hall/CRC. 2022,
#> doi:10.1201/9781003279242, ISBN: 9781032233574
#>
#> Attaching package: ‘ggtree’
#> The following object is masked from ‘package:gggenomes’:
#>
#> flip
#> Warning: Tree and genomes have different y-scale expansions. This can cause slight misalignments of leaves and sequences.
#> Consider adding `+ scale_y_continuous(expand=c(0.01,0.7,0.01,0.7))` to the tree as a fix
#> • tree: 0,0.6,0,0.6
#> • bins: 0.01,0.7,0.01,0.7
#> Some bin_ids are missing in the tree, will drop those from genomes.
#> • One more genome
#> Warning: Tree and genomes have different y-scale expansions. This can cause slight misalignments of leaves and sequences.
#> Consider adding `+ scale_y_continuous(expand=c(0.01,0.7,0.01,0.7))` to the tree as a fix
#> • tree: 0,0.6,0,0.6
#> • bins: 0.01,0.7,0.01,0.7
#> Error in pick_by_tree(., t) :
#> No shared bin_ids between tree and genomes. Check your IDs.
try({ # can fail on older systems with older ggtree versions
# Align sequences with and plot next to a phylogenetic tree
library(patchwork) # arrange multiple plots
library(ggtree) # plot phylogenetic trees
# load and plot a phylogenetic tree
emale_mcp_tree <- read.tree(ex("emales/emales-MCP.nwk"))
t <- ggtree(emale_mcp_tree) + geom_tiplab(align = TRUE, size = 3) +
xlim(0, 0.05) # make room for labels
p <- gggenomes(seqs = emale_seqs, genes = emale_genes) +
geom_seq() + geom_seq() + geom_bin_label()
# plot next to each other, but with
# different order in tree and genomes
t + p + plot_layout(widths = c(1, 5))
# reorder genomes to match tree order
# with a warning caused by mismatch in y-scale expansions
t + p %>% pick_by_tree(t) + plot_layout(widths = c(1, 5))
# extra genomes are dropped with a notification
emale_seqs_more <- emale_seqs
emale_seqs_more[7, ] <- emale_seqs_more[6, ]
emale_seqs_more$seq_id[7] <- "One more genome"
p <- gggenomes(seqs = emale_seqs_more, genes = emale_genes) +
geom_seq() + geom_seq() + geom_bin_label()
t + p %>% pick_by_tree(t) + plot_layout(widths = c(1, 5))
# no shared ids will cause an error
p <- gggenomes(seqs = tibble::tibble(seq_id = "foo", length = 1)) +
geom_seq() + geom_seq() + geom_bin_label()
t + p %>% pick_by_tree(t) + plot_layout(widths = c(1, 5))
# extra leafs in tree will cause an error
emale_seqs_fewer <- slice_head(emale_seqs, n = 4)
p <- gggenomes(seqs = emale_seqs_fewer, genes = emale_genes) +
geom_seq() + geom_seq() + geom_bin_label()
t + p %>% pick_by_tree(t) + plot_layout(widths = c(1, 5))
})
#> ggtree v4.0.4 Learn more at https://yulab-smu.top/contribution-tree-data/
#>
#> Please cite:
#>
#> Guangchuang Yu. Data Integration, Manipulation and Visualization of
#> Phylogenetic Trees (1st edition). Chapman and Hall/CRC. 2022,
#> doi:10.1201/9781003279242, ISBN: 9781032233574
#>
#> Attaching package: ‘ggtree’
#> The following object is masked from ‘package:gggenomes’:
#>
#> flip
#> Warning: Tree and genomes have different y-scale expansions. This can cause slight misalignments of leaves and sequences.
#> Consider adding `+ scale_y_continuous(expand=c(0.01,0.7,0.01,0.7))` to the tree as a fix
#> • tree: 0,0.6,0,0.6
#> • bins: 0.01,0.7,0.01,0.7
#> Some bin_ids are missing in the tree, will drop those from genomes.
#> • One more genome
#> Warning: Tree and genomes have different y-scale expansions. This can cause slight misalignments of leaves and sequences.
#> Consider adding `+ scale_y_continuous(expand=c(0.01,0.7,0.01,0.7))` to the tree as a fix
#> • tree: 0,0.6,0,0.6
#> • bins: 0.01,0.7,0.01,0.7
#> Error in pick_by_tree(., t) :
#> No shared bin_ids between tree and genomes. Check your IDs.